5. Analyze data
Datum objave: 08. 04. 2017 Datum zadnjega pregleda: 08. 04. 2017
In order to perform online analyses and/or download data files, you need to have a valid username and password.
Be sure to follow the general terms of use that you accepted at the point of registration.
We create a table by clicking the tab Tabulation. One or more variables of a study may be included in the table. If we click on the tab Tabulation, we get an empty table.
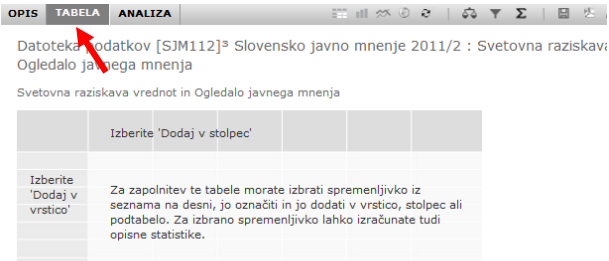
On the left pane of Nesstar Webview we search an appropriate variable (in the section Variable Description). By clicking the variable (left mouse click) a selection field opens.
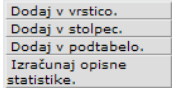
- Add variable in row
- Add variable in collumn
- Create a field for a variable above the table. This is our control variable, which means that we wish to show only data for one category in the table.
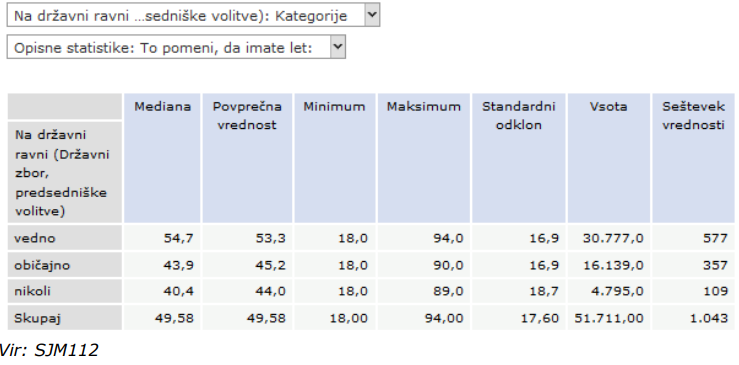
- For numerical variables Descriptive statistics can be calculated.
We can include more variables in each row or column. They will be shown as nested in the table. An example of descriptive statistics calculation in a table:
We can empty a table by clicking the button for deletion. An individual variable can also be deleted by using the drop-down menu above the table (see below).
The drop down menu enables additional options, such as moving of a variable in another row/column etc.
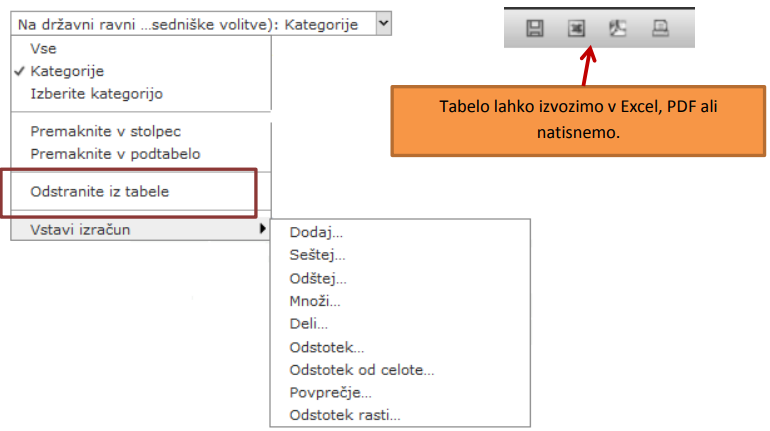
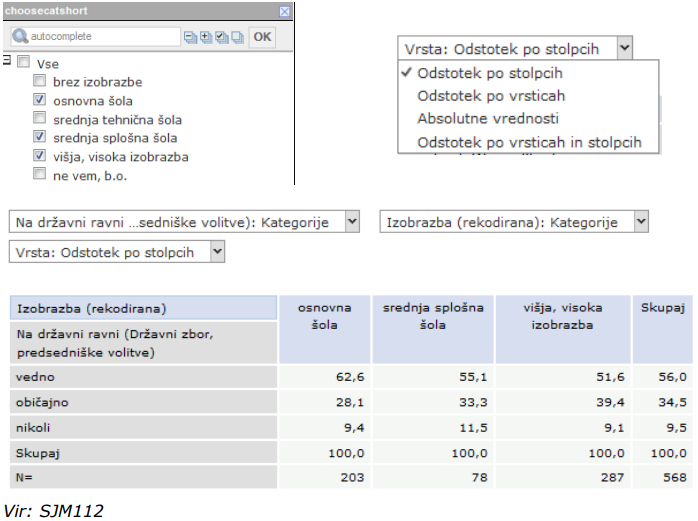
The content of the table can be shown in percentage in columns, in rows, in absolute values or in percentage in rows and columns.
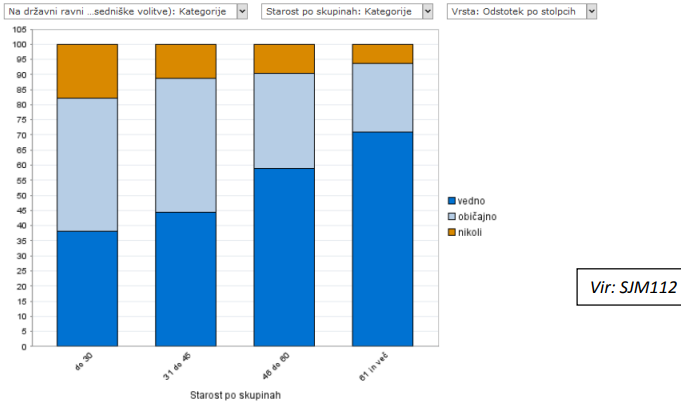
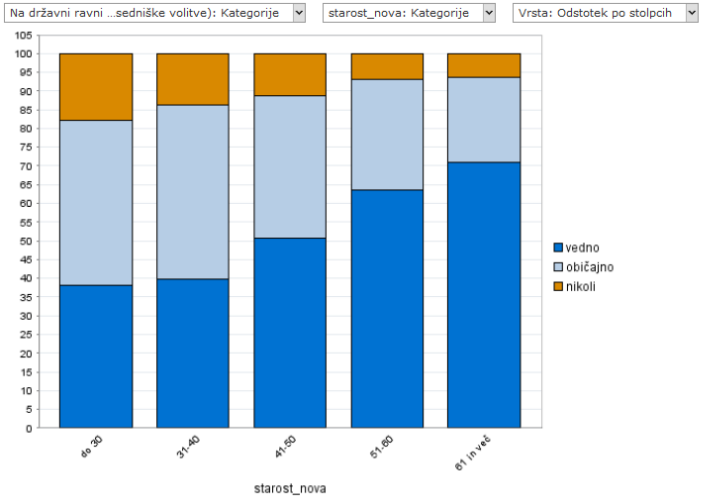
Nesstar browser offers some basic graphic representations of data, arising from the tabs Tabulation and Analysis. By clicking the graph button, we can graphically visualize all variables, included in our table. If needed, we can represent only selected variables in the graphic representation.
We may choose between a bar chart, pie chart, confidence interval graph or scatter plot. The time series graph is only available when a time variable/dimension is present in a table, for example, a 'year' variable. For this option to become available, 'Time' variables/dimensions have to be identified as such within Nesstar Publisher. A scatterplot is available for regression analyses and will be available instead of the time series icon.
An example of a graphic visualization on Nesstar browser:
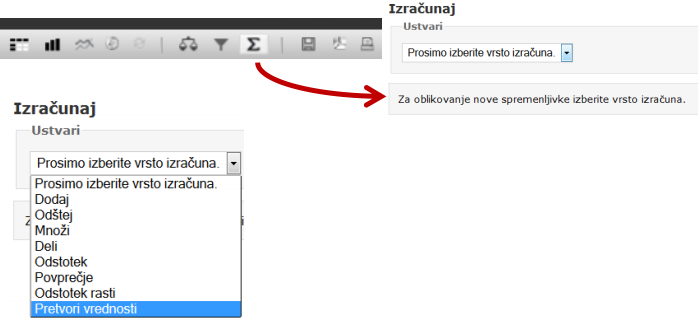
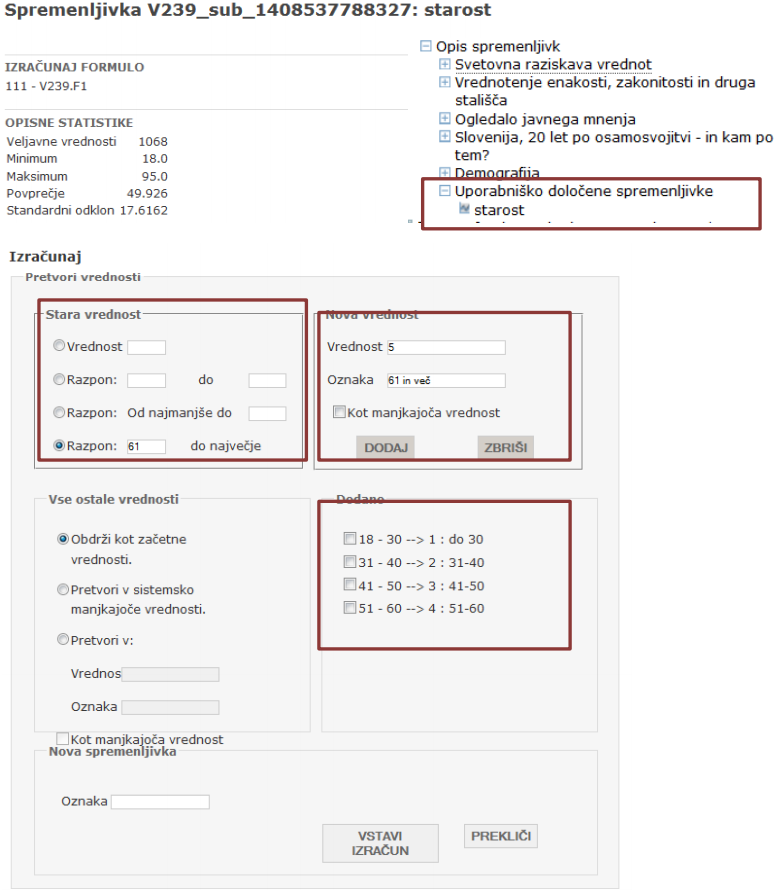
In order to test our hypotheses, we need to sometimes adjust our variables. Lets look at an example: usually, the demography section of a study includes a question of a year of birth of the respondent. It is assumed that the year of birth is more easy to remember and more likely to answer correctly then when asked how old are we.
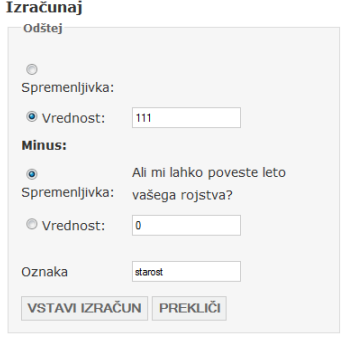
To determine the age of the respondents of a study in time of data collection, we need to calculate a new variable that is YEAR OF DATA COLLECTION – YEAR OF RESPONDENT'S BIRTH. It is advisable to group this variable for future analyses according to theory or other appropriate rules.
Year 2011 – since in a data file the year of birth is a two-digit number, we need to use 111 in our calculations (instead of 2011).
We get the following results:
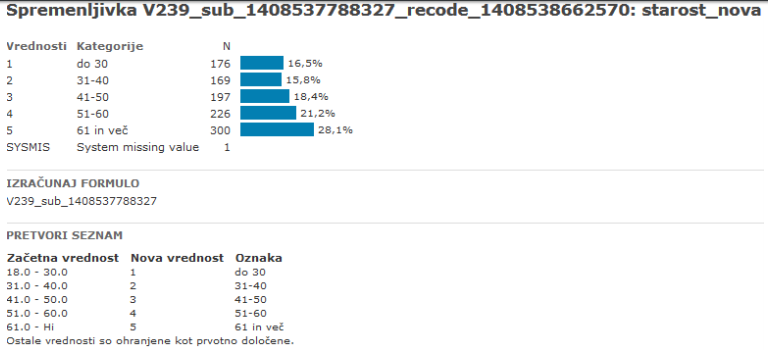
By using the newely created variable we can prepare a table and a graph.
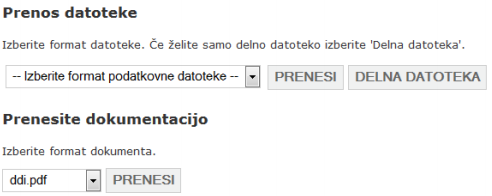
You can download the data file and the study description from Nesstar browser on the following way:
On the left side of the Nesstar webview select the appropriate study (for example SJM112). Above the main view window, click on the diskette icon (top right corner).

Select:
- You can download the data file in the following formats: SPSS (*.sav), SPSS Portable (*.por), Statistica, Stata v.8, Stata v.7. DIF, Dbase, SAS
- You can download the study documentation in PDF and XML formats.
Kako citiram to stran?
Arhiv družboslovnih podatkov. LETO. 5. Analyze data. Dostopano prek: http://adp.fdv.uni-lj.si/eng/uporabi/kako/analiza/ (DD. mesec leto).
AKTUALNI DOGODKI
4. april 2024
Spletni seminar SPOZNAJ: Podatkovne objave v odprti znanosti
14. marec 2024
Predstavitev novega učbenika: Odprta učna gradiva z uporabo odprtih raziskovalnih podatkov
NOVICE
Raziskave o Covid-19 iz kataloga CESSDA vključene v Podatkovni portal COVID-19
Projekt SPOZNAJ
V ADP HRANIMO TUDI
Politbarometer PB11/01, Slovenija, november 2001, UVI
ZADNJE OBJAVLJENE RAZISKAVE
AKTIVNOSTI ADP
Spletni seminar SPOZNAJ: Podatkovne objave v odprti znanosti
Predstavitev novega učbenika: Odprta učna gradiva z uporabo odprtih raziskovalnih podatkov
KONFERENCE IN DOGODKI
Spletni seminar: Emerging Longitudinal Scholars: Midlife, employment, engagement and wellbeing